File:Integergk,k=4,s=0plot.png
From timescalewiki
Revision as of 22:19, 2 June 2016 by Tom (talk | contribs) (Category:plot Category:deltagk Category:timescale:integers Category:specialfunction <pre>#!/usr/bin/python import numpy as np import matplotlib.pyplot as plt from mpmath import * from pylab import rcParams rcParams['figure.figsize'] = 1...)
Size of this preview: 581 × 600 pixels. Other resolutions: 233 × 240 pixels | 872 × 900 pixels.
Original file (872 × 900 pixels, file size: 21 KB, MIME type: image/png)
#!/usr/bin/python
import numpy as np
import matplotlib.pyplot as plt
from mpmath import *
from pylab import rcParams
rcParams['figure.figsize'] = 10, 10
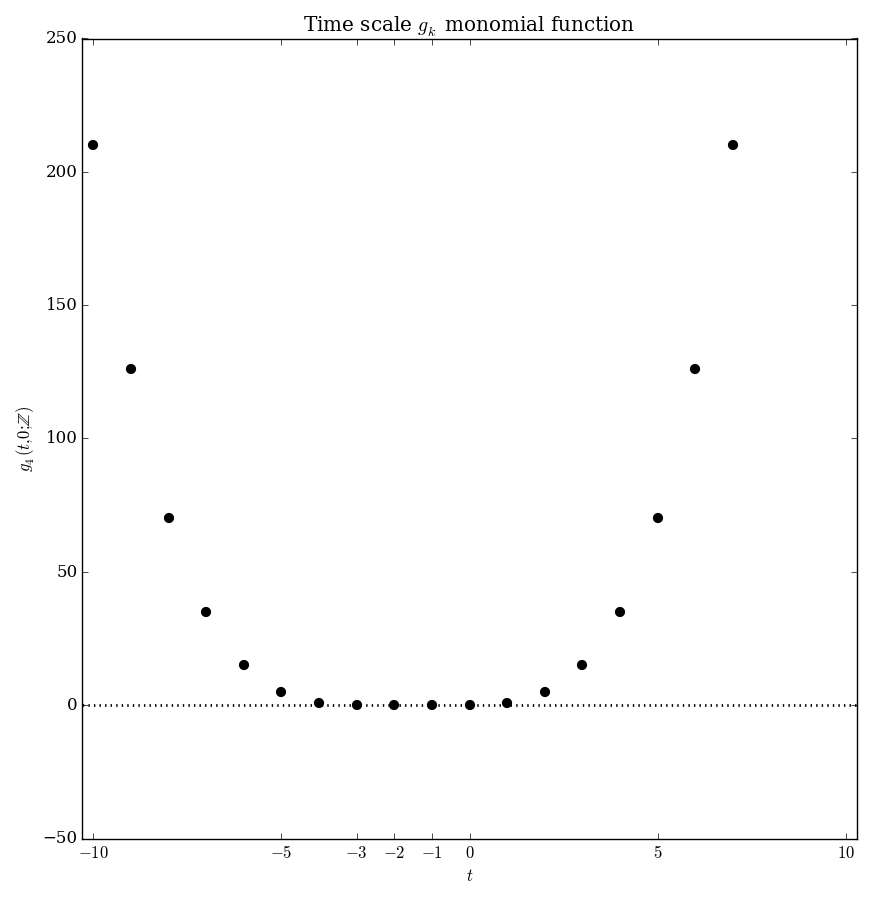
def integerhk(k,t,s):
return binomial(t-s,k)
def integergk(k,t,s):
return ((-1)**k)*integerhk(k,s,t)
def g(x):
return 0
x=np.arange(-10,8,1)
x2=np.arange(-20,20,1)
f=np.vectorize(lambda x: integergk(4,x,0))
y=f(x)
h=np.vectorize(g)
y2=h(x2)
fig, ax = plt.subplots()
plt.xlabel(r'$t$')
plt.ylabel(r'$g_4(t,0;\mathbb{Z})$')
plt.title(r'Time scale $g_k$ monomial function')
xlabels = [item.get_text() for item in ax.get_yticklabels()]
xlabels=[r'$-10$',r'$-5$',r'$-3$',r'$-2$',r'$-1$',r'$0$',r'$5$',r'$10$',r'$15$']
ax.set_xticks([-10,-5,-3,-2,-1,0,5,10,15])
ax.set_xticklabels(xlabels)
plt.scatter(x,y,color='Black',s=40)
plt.plot(x2,y2,':',linewidth=2,color='Black')
plt.xlim([-10.3,10.3])
plt.savefig('integergk,k=4,s=0plot.png',bbox_inches='tight',pad_inches=0.15)
File history
Click on a date/time to view the file as it appeared at that time.
| Date/Time | Thumbnail | Dimensions | User | Comment | |
|---|---|---|---|---|---|
| current | 22:19, 2 June 2016 | | 872 × 900 (21 KB) | Tom (talk | contribs) | Category:plot Category:deltagk Category:timescale:integers Category:specialfunction <pre>#!/usr/bin/python import numpy as np import matplotlib.pyplot as plt from mpmath import * from pylab import rcParams rcParams['figure.figsize'] = 1... |
- You cannot overwrite this file.
File usage
The following page links to this file: