File:Integerdeltaexponential,a=1,s=0glyph.png
From timescalewiki
Revision as of 23:52, 31 May 2016 by Tom (talk | contribs) (Category:deltaexponentialglyph Category:glyph Category:timeScale:integers Category:deltaexponential <pre>#!/usr/bin/python import numpy as np import matplotlib.pyplot as plt from mpmath import * from pylab import rcParams rcParams['figu...)
No higher resolution available.
Integerdeltaexponential,a=1,s=0glyph.png (186 × 192 pixels, file size: 2 KB, MIME type: image/png)
#!/usr/bin/python
import numpy as np
import matplotlib.pyplot as plt
from mpmath import *
from pylab import rcParams
rcParams['figure.figsize'] = 2.4,2.4
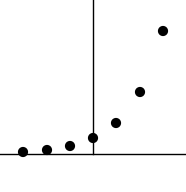
x=np.arange(-2,5,1)
def integerexp(a,t,s):
return (1+a)**(t-s)
f=np.vectorize(lambda x: integerexp(1,x,0))
y=f(x)
fig, ax = plt.subplots()
#plt.ylim([-1.1,1.1])
#plt.xlim([-1.05,1.05])
ax.spines['left'].set_position('center')
ax.spines['right'].set_color('none')
ax.spines['bottom'].set_position(('axes',0.2))
ax.spines['top'].set_color('none')
ax.spines['left'].set_smart_bounds(True)
ax.spines['bottom'].set_smart_bounds(True)
ax.xaxis.set_ticks_position('none')
plt.tick_params(axis='x', which='both', bottom='off', top='off', labelbottom='off')
plt.tick_params(axis='y', which='both', left='off', right='off', labelleft='off')
plt.scatter(x,y,color='Black',s=40)
plt.savefig('integerdeltaexponential,a=1,s=0glyph.png',bbox_inches='tight',pad_inches=0.0)
File history
Click on a date/time to view the file as it appeared at that time.
| Date/Time | Thumbnail | Dimensions | User | Comment | |
|---|---|---|---|---|---|
| current | 23:52, 31 May 2016 | | 186 × 192 (2 KB) | Tom (talk | contribs) | Category:deltaexponentialglyph Category:glyph Category:timeScale:integers Category:deltaexponential <pre>#!/usr/bin/python import numpy as np import matplotlib.pyplot as plt from mpmath import * from pylab import rcParams rcParams['figu... |
- You cannot overwrite this file.
File usage
There are no pages that link to this file.