File list
This special page shows all uploaded files.
| Date | Name | Thumbnail | Size | Description | Versions |
|---|---|---|---|---|---|
| 19:53, 10 June 2014 | Hilger circles.png (file) | 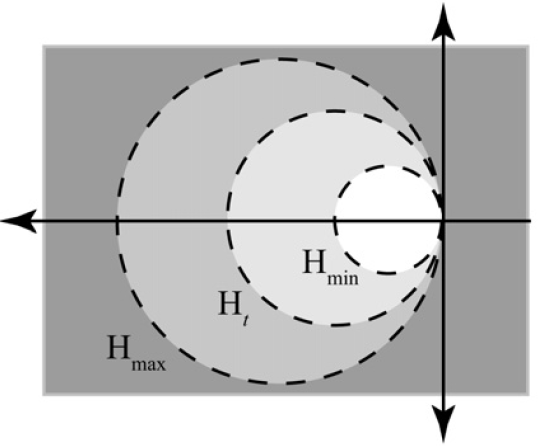 |
58 KB | This image is from the paper Davis, John M. ; Gravagne, Ian A. ; Jackson, Billy J. ; Marks, Robert J., II ; Ramos, Alice A. The Laplace transform on time scales revisited. J. Math. Anal. Appl. 332 (2007), no. 2, 1291--1307. | 1 |
| 20:46, 15 July 2014 | Hilgercircle,T=hZ.png (file) | 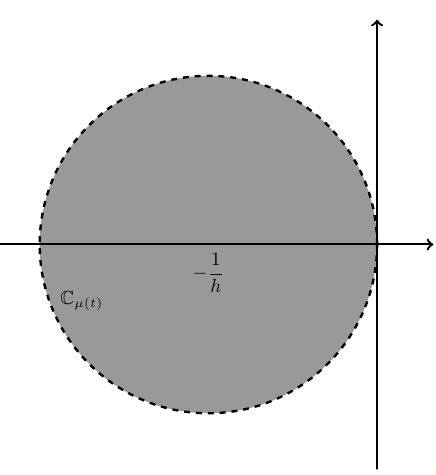 |
11 KB | The time scale $\mathbb{T}=h\mathbb{Z}$ has constant graininess function $\mu \equiv h$. Hence if $z$ is a regressive constant, then $$1 + hz \neq 0$$ or $$z \neq -\dfrac{1}{h}.$$ | 1 |
| 06:03, 19 October 2014 | Sin 1T=Z.png (file) |  |
9 KB | 1 | |
| 06:11, 19 October 2014 | Cos 1T=Z.png (file) |  |
7 KB | 1 | |
| 02:59, 28 March 2015 | HZtime scale.png (file) | 11 KB | 1 | ||
| 03:08, 28 March 2015 | Closureunitfractionstimescale.png (file) | 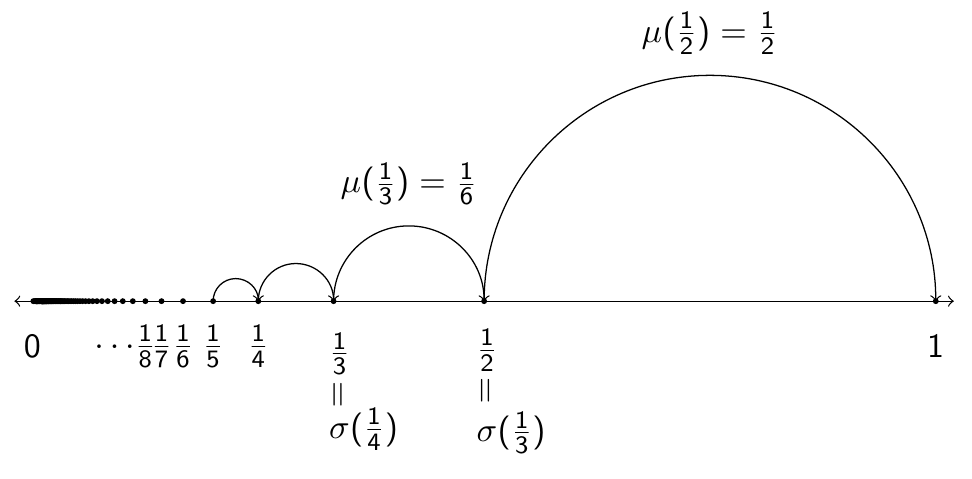 |
26 KB | 1 | |
| 01:29, 22 May 2015 | Hilgercircle,T=Z.png (file) | 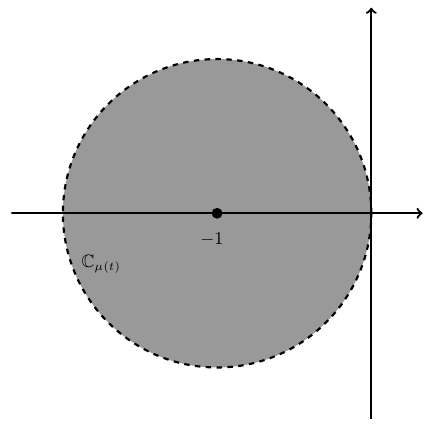 |
10 KB | 2 | |
| 22:23, 31 May 2016 | Integerexponential,a=2,s=-1plot.png (file) | 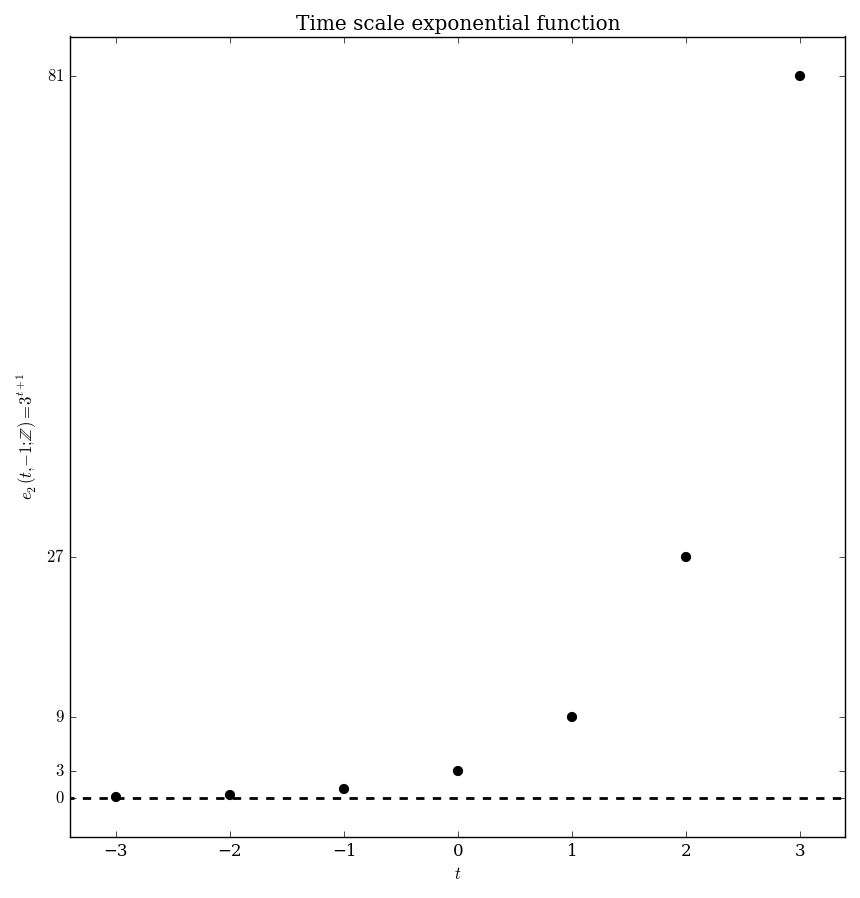 |
20 KB | Category:Plot Category:TimeScaleExponential <pre>#!/usr/bin/python import numpy as np import matplotlib.pyplot as plt from mpmath import * from pylab import rcParams rcParams['figure.figsize'] = 10, 10 x=np.arange(-3,4,1); x2=np.arange(-20,20,... | 1 |
| 22:37, 31 May 2016 | Integerexponential,a=2,s=0plot.png (file) | 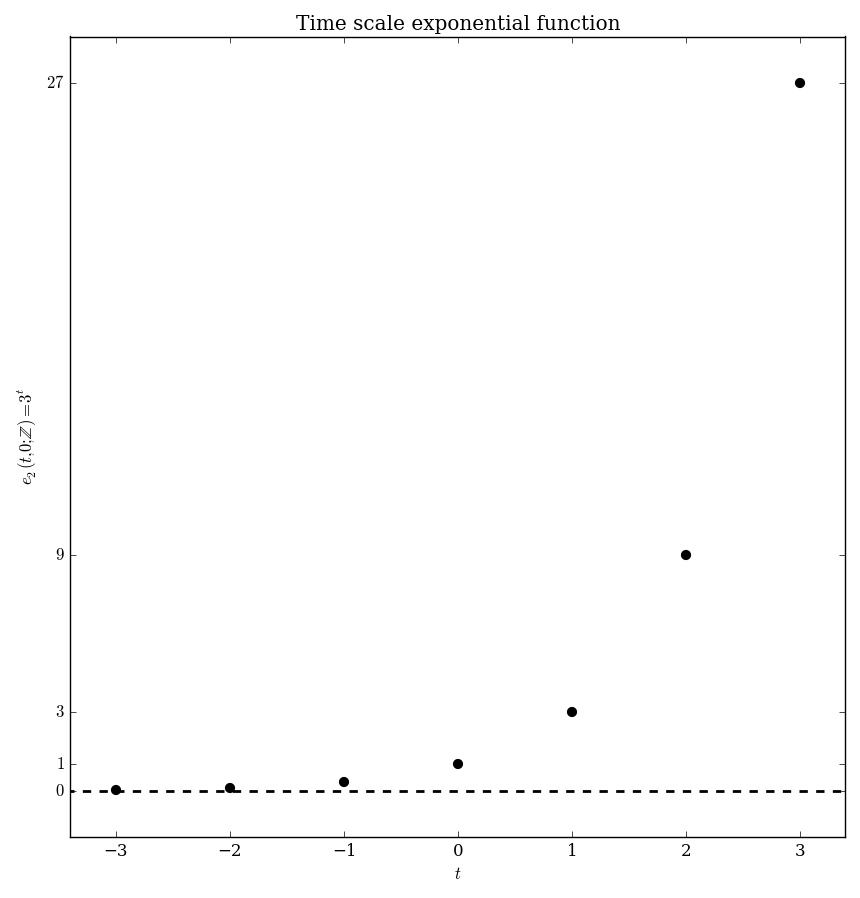 |
19 KB | Category:Plot Category:TimeScaleDeltaExponential Category:TimeScale:Integers <pre>#!/usr/bin/python import numpy as np import matplotlib.pyplot as plt from mpmath import * from pylab import rcParams rcParams['figure.figsize'] = 10, 10 x=n... | 1 |
| 22:44, 31 May 2016 | Integerexponential,a=2,s=1plot.png (file) | 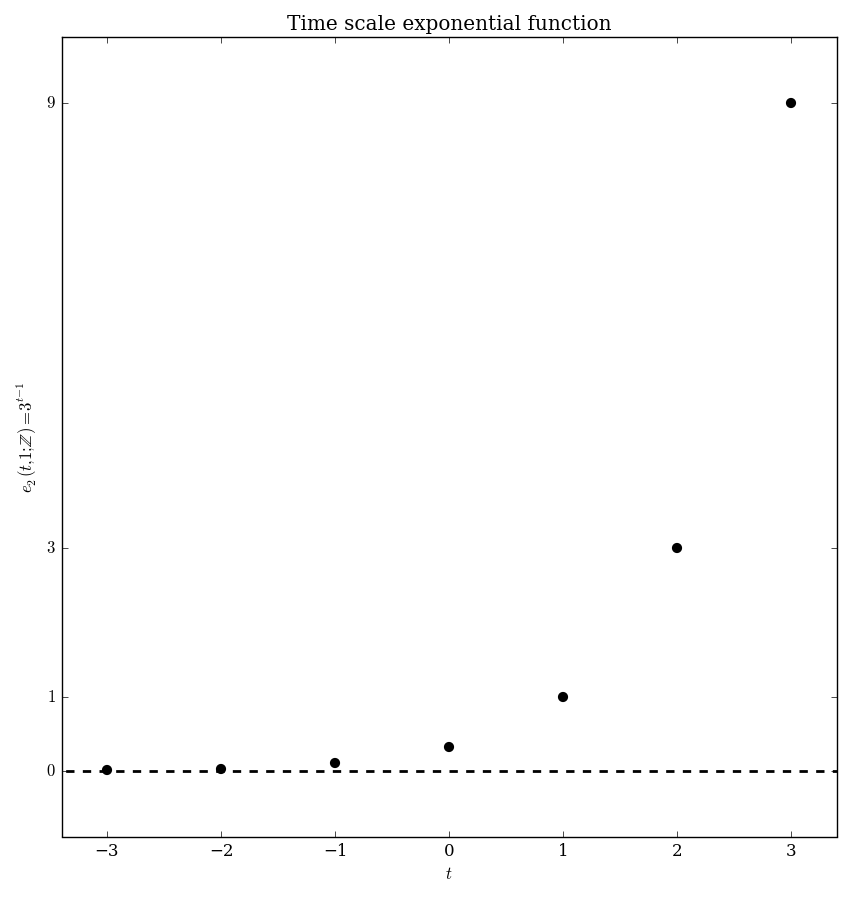 |
18 KB | Category:Plot Category:TimeScaleDeltaExponential Category:TimeScale:Integers <pre>#!/usr/bin/python import numpy as np import matplotlib.pyplot as plt from mpmath import * from pylab import rcParams rcParams['figure.figsize'] = 10, 10 x=n... | 1 |
| 23:52, 31 May 2016 | Integerdeltaexponential,a=1,s=0glyph.png (file) | 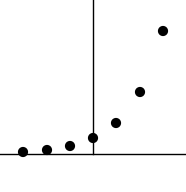 |
2 KB | Category:deltaexponentialglyph Category:glyph Category:timeScale:integers Category:deltaexponential <pre>#!/usr/bin/python import numpy as np import matplotlib.pyplot as plt from mpmath import * from pylab import rcParams rcParams['figu... | 1 |
| 00:33, 1 June 2016 | Integerdeltaexponential,a=-3,s=0glyph.png (file) | 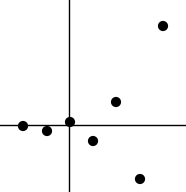 |
2 KB | Category:deltaexponentialglyph Category:glyph Category:timeScale:integers Category:deltaexponential <pre>#!/usr/bin/python import numpy as np import matplotlib.pyplot as plt from mpmath import * from pylab import rcParams rcParams['fig... | 1 |
| 06:59, 1 June 2016 | Integerdeltasine,a=0.6,s=0plot.png (file) | 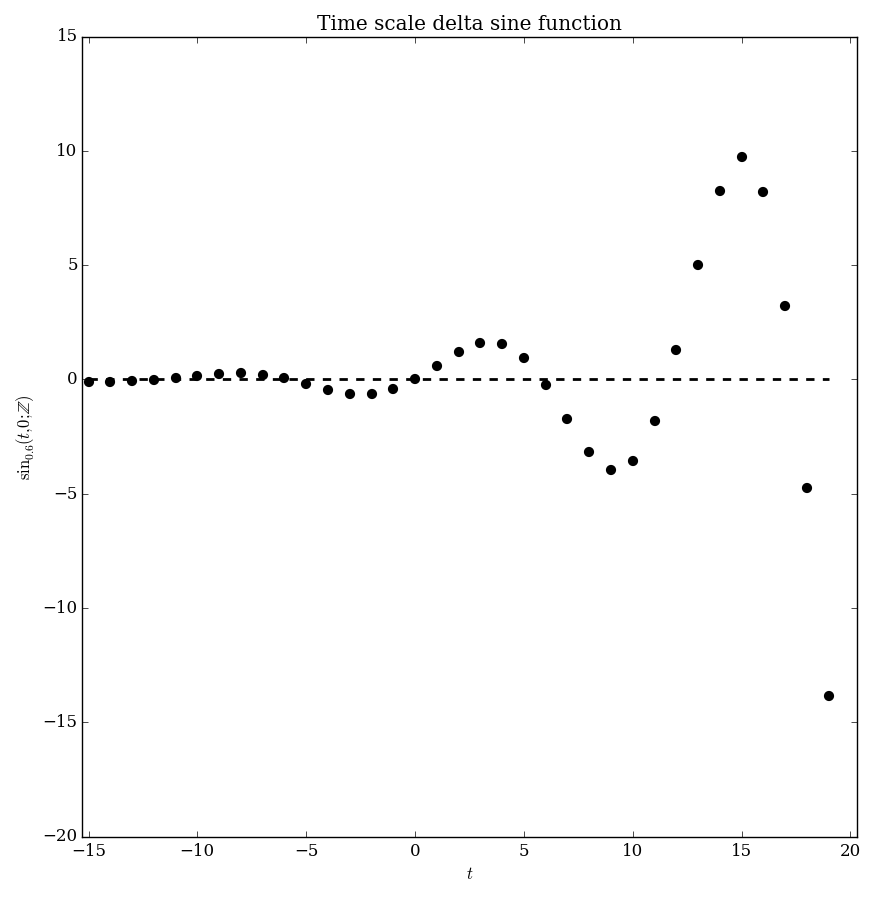 |
24 KB | Category:Plot Category:TimeScaleDeltaExponential Category:TimeScale:Integers Category:SpecialFunction <pre>#!/usr/bin/python import numpy as np import matplotlib.pyplot as plt from mpmath import * from pylab import rcParams rcParams['fi... | 1 |
| 07:11, 1 June 2016 | Integerdeltasine,a=0.6,s=0glyph.png (file) |  |
2 KB | Category:deltasineglyph Category:glyph Category:timescale:integers Category:deltasine <pre>#!/usr/bin/python import numpy as np import matplotlib.pyplot as plt from mpmath import * from pylab import rcParams rcParams['figure.figsize'] =... | 1 |
| 07:24, 1 June 2016 | Integerdeltacosine,a=0.6,s=0plot.png (file) | 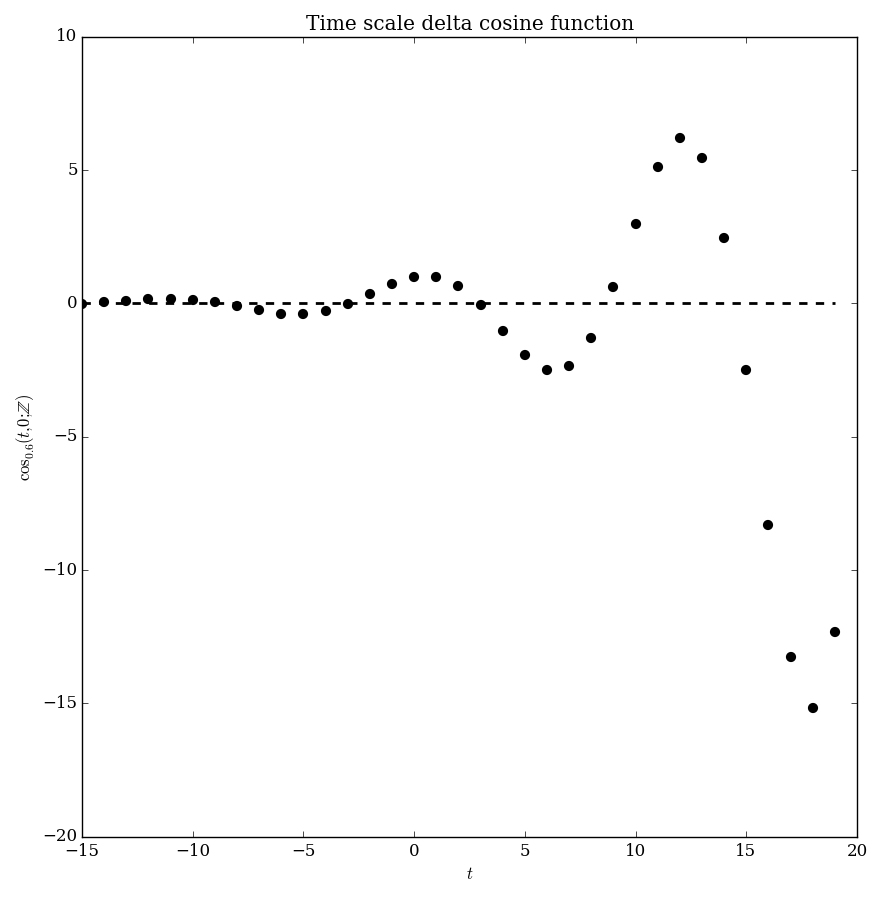 |
24 KB | Category:plot Category:deltacosine Category:timescale:integers Category:specialfunction <pre>#!/usr/bin/python import numpy as np import matplotlib.pyplot as plt from mpmath import * from pylab import rcParams rcParams['figure.figsize']... | 1 |
| 07:46, 1 June 2016 | Integerdeltacosine,a=0.6,s=0glyph.png (file) |  |
2 KB | Category:deltasineglyph Category:glyph Category:timescale:integers Category:deltasine <pre>#!/usr/bin/python import numpy as np import matplotlib.pyplot as plt from mpmath import * from pylab import rcParams rcParams['figure.figsize'] =... | 1 |
| 07:55, 1 June 2016 | Integercosh,a=0.6,s=0plot.png (file) | 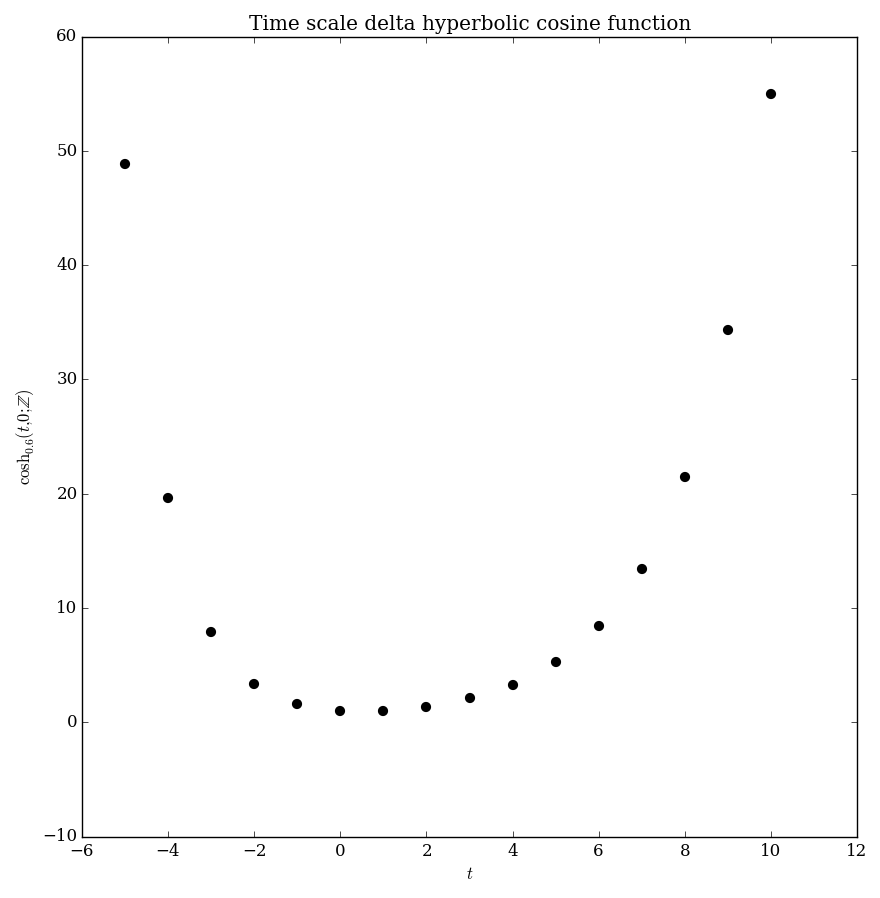 |
26 KB | Category:plot Category:deltaexponential Category:timescale:integers Category:specialfunction <pre>#!/usr/bin/python import numpy as np import matplotlib.pyplot as plt from mpmath import * from pylab import rcParams rcParams['figure.figs... | 1 |
| 08:01, 1 June 2016 | Integerdeltasinh,a=0.6,s=0plot.png (file) | 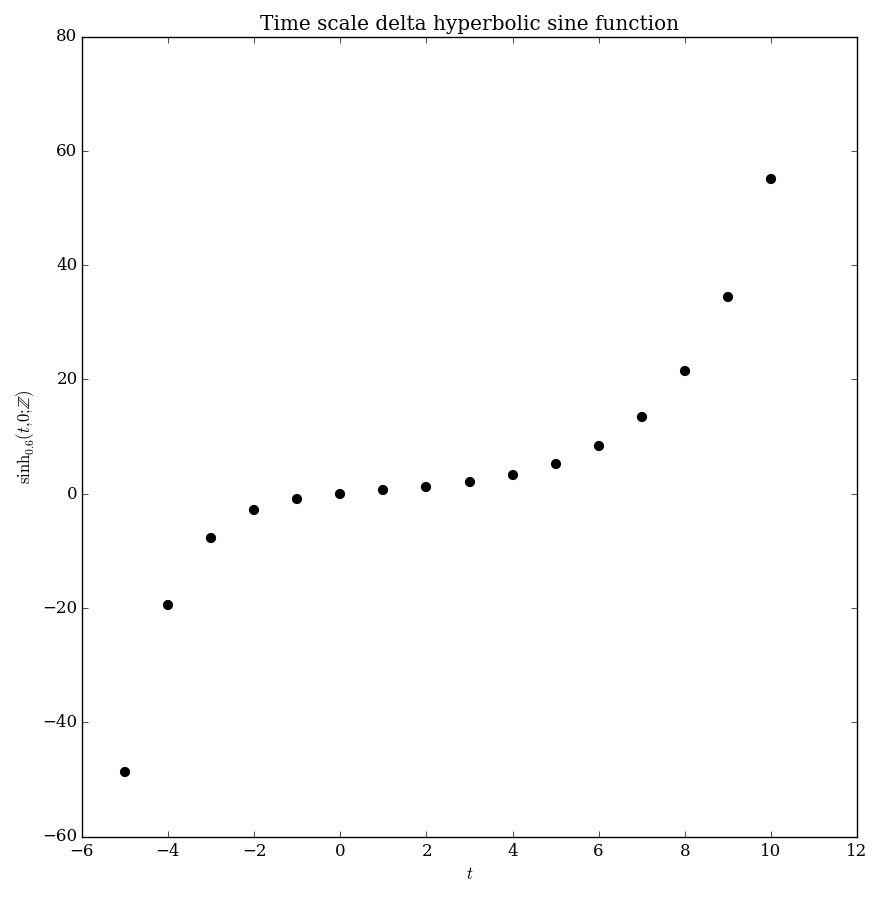 |
27 KB | Category:plot Category:deltasinh Category:timescale:integers Category:specialfunction <pre>#!/usr/bin/python import numpy as np import matplotlib.pyplot as plt from mpmath import * from pylab import rcParams rcParams['figure.figsize'] =... | 1 |
| 19:31, 1 June 2016 | Integerdeltacosh,a=0.6,s=0glyph.png (file) |  |
2 KB | Category:deltacoshglyph Category:glyph Category:timescale:integers Category:deltacosh <pre>#!/usr/bin/python import numpy as np import matplotlib.pyplot as plt from mpmath import * from pylab import rcParams rcParams['figure.figsize'] =... | 1 |
| 19:39, 1 June 2016 | Integerdeltasinhglyph,a=0.6,s=0glyph.png (file) |  |
2 KB | Category:deltasineglyph Category:glyph Category:timescale:integers Category:deltasine <pre>#!/usr/bin/python import numpy as np import matplotlib.pyplot as plt from mpmath import * from pylab import rcParams rcParams['figure.figsize'] =... | 1 |
| 19:54, 1 June 2016 | Integerhk,k=2,s=0plot.png (file) | 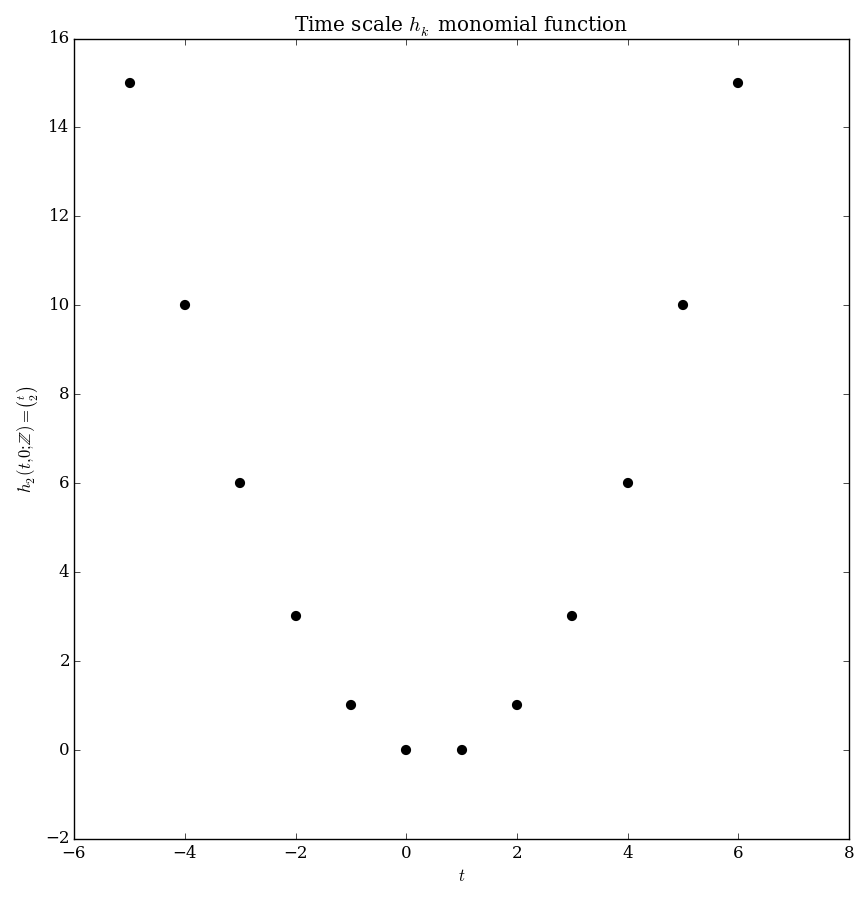 |
21 KB | Category:plot Category:deltahk Category:timescale:integers Category:specialfunction <pre>#!/usr/bin/python import numpy as np import matplotlib.pyplot as plt from mpmath import * from pylab import rcParams rcParams['figure.figsize'] = 1... | 1 |
| 19:55, 1 June 2016 | Integerhk,k=3,s=0plot.png (file) | 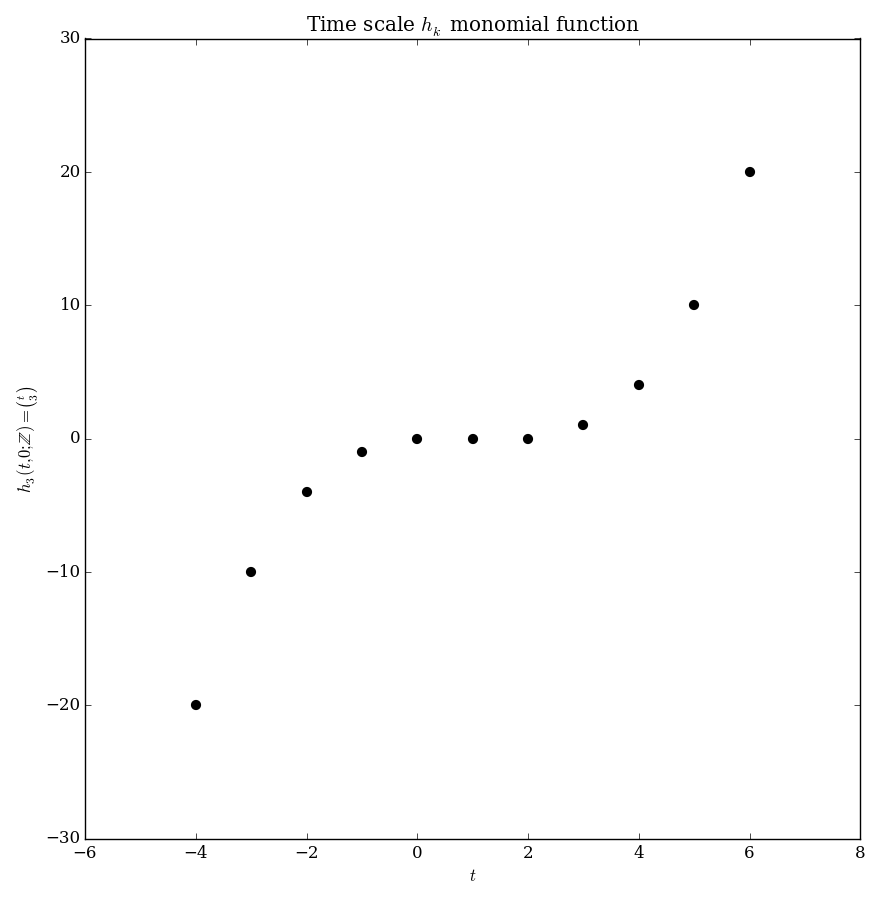 |
22 KB | Category:plot Category:deltahk Category:timescale:integers Category:specialfunction <pre>#!/usr/bin/python import numpy as np import matplotlib.pyplot as plt from mpmath import * from pylab import rcParams rcParams['figure.figsize'] = 1... | 1 |
| 19:55, 1 June 2016 | Integerhk,k=4,s=0plot.png (file) | 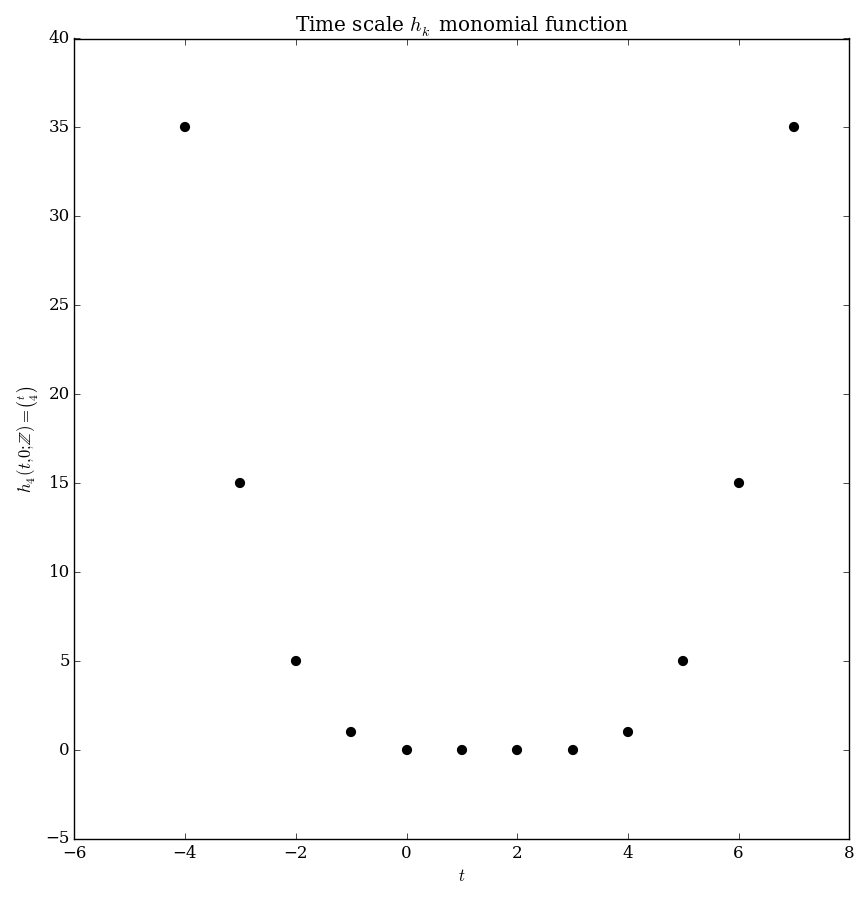 |
22 KB | Category:plot Category:deltahk Category:timescale:integers Category:specialfunction <pre>#!/usr/bin/python import numpy as np import matplotlib.pyplot as plt from mpmath import * from pylab import rcParams rcParams['figure.figsize'] = 1... | 1 |
| 18:56, 2 June 2016 | Integerdeltahk,k=2,s=0glyph.png (file) |  |
2 KB | Category:deltahkglyph Category:glyph Category:timescale:integers Category:deltahk <pre>#!/usr/bin/python import numpy as np import matplotlib.pyplot as plt from mpmath import * from pylab import rcParams rcParams['figure.figsize'] = 2.... | 1 |
| 18:59, 2 June 2016 | Integerdeltahk,k=3,s=0glyph.png (file) |  |
2 KB | Category:deltahk Category:glyph Category:timescale:integers Category:deltahk <pre>#!/usr/bin/python import numpy as np import matplotlib.pyplot as plt from mpmath import * from pylab import rcParams rcParams['figure.figsize'] = 2.4,2.4... | 1 |
| 19:17, 2 June 2016 | Integergk,k=3,s=0plot.png (file) | 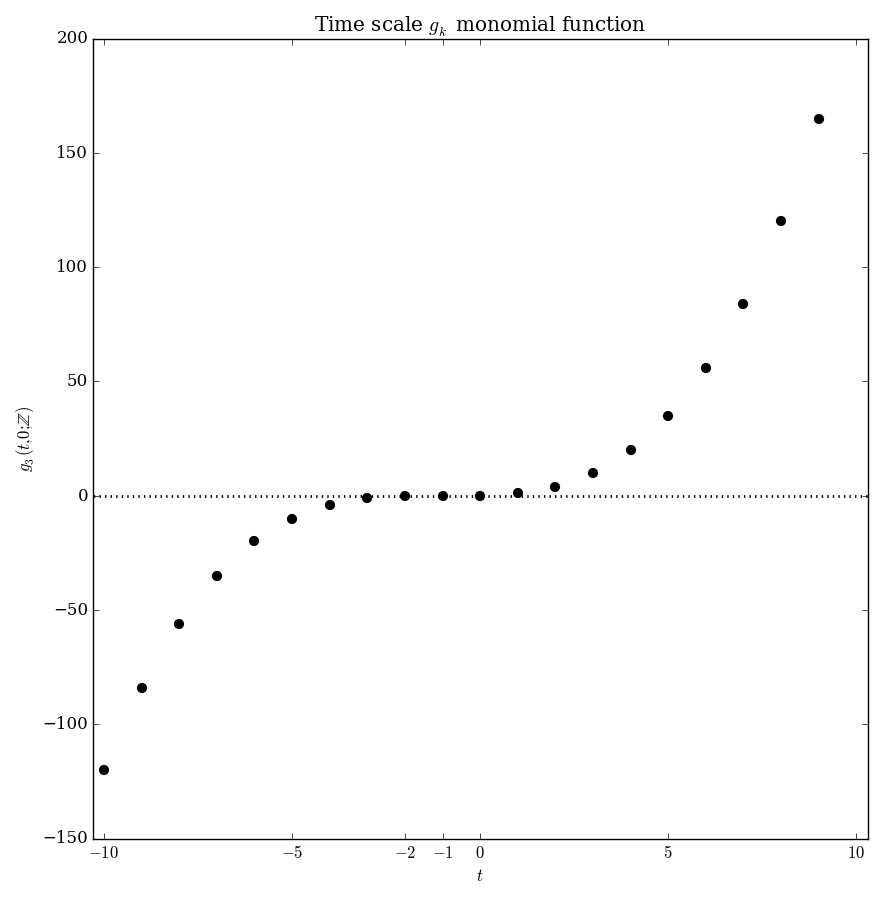 |
23 KB | Category:plot Category:deltagk Category:timescale:integers Category:specialfunction <pre>#!/usr/bin/python import numpy as np import matplotlib.pyplot as plt from mpmath import * from pylab import rcParams rcParams['figure.figsize'] = 1... | 1 |
| 19:24, 2 June 2016 | Integergk,k=2,s=0plot.png (file) | 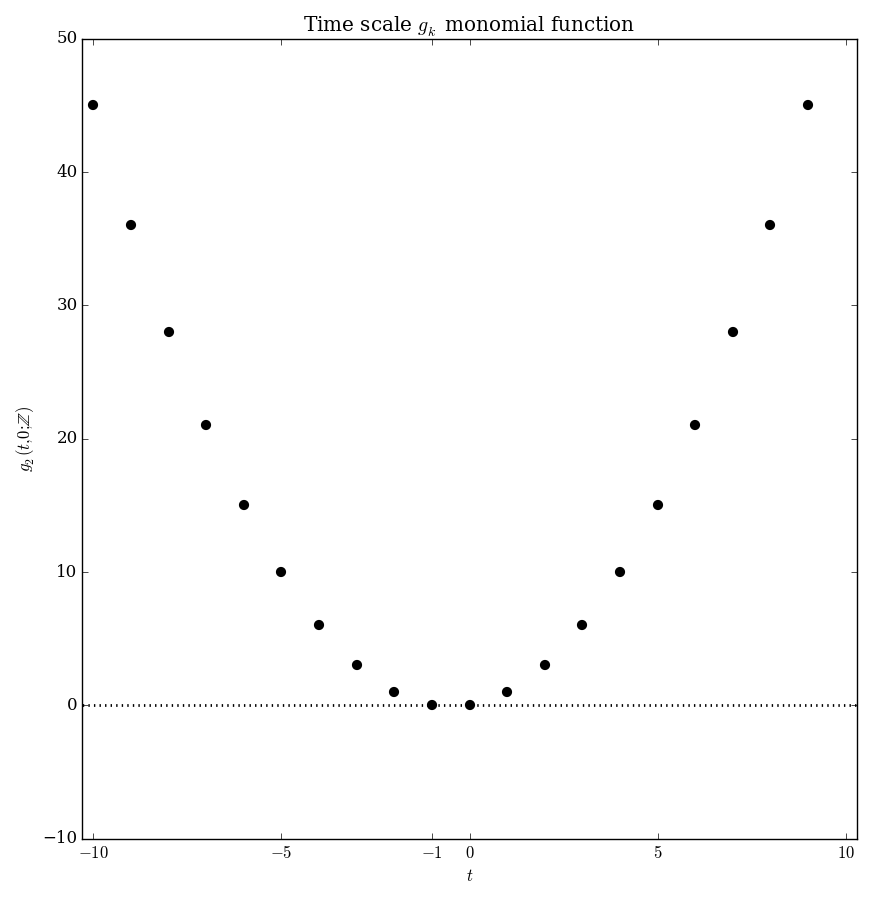 |
20 KB | Category:plot Category:deltagk Category:timescale:integers Category:specialfunction <pre>#!/usr/bin/python import numpy as np import matplotlib.pyplot as plt from mpmath import * from pylab import rcParams rcParams['figure.figsize'] = 1... | 1 |
| 22:15, 2 June 2016 | Integerhk,k=5,s=0plot.png (file) | 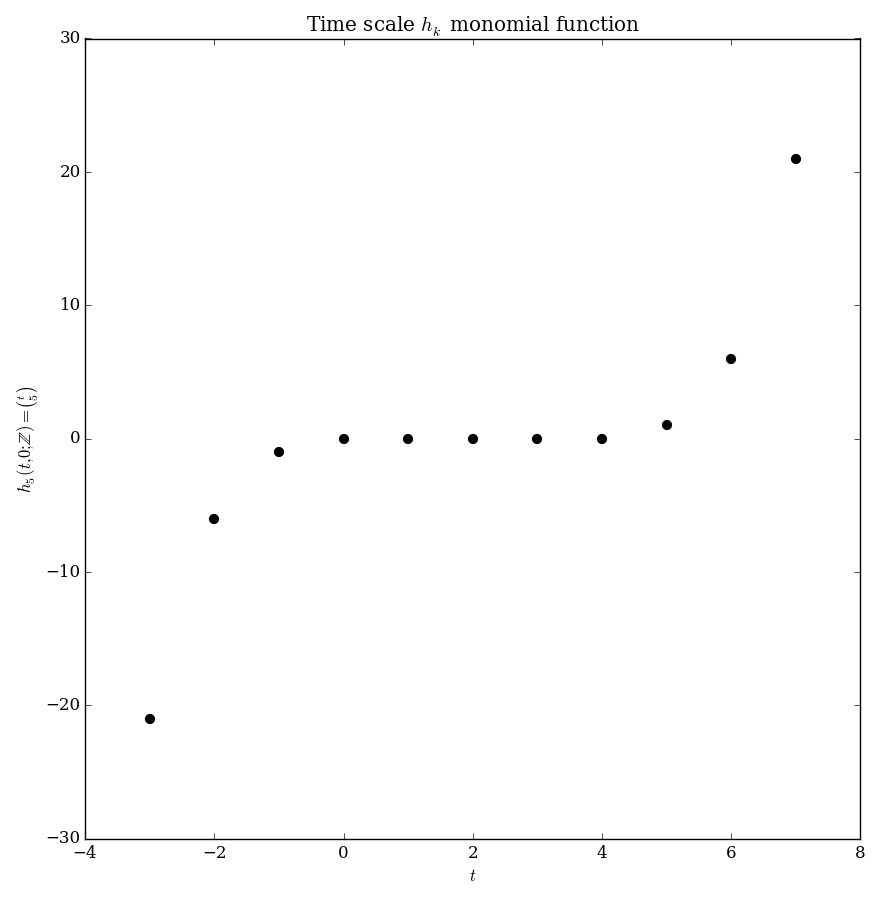 |
21 KB | Category:plot Category:deltagk Category:timescale:integers Category:specialfunction <pre>#!/usr/bin/python import numpy as np import matplotlib.pyplot as plt from mpmath import * from pylab import rcParams rcParams['figure.figsize'] = 1... | 2 |
| 22:16, 2 June 2016 | Integergk,k=5,s=0plot.png (file) | 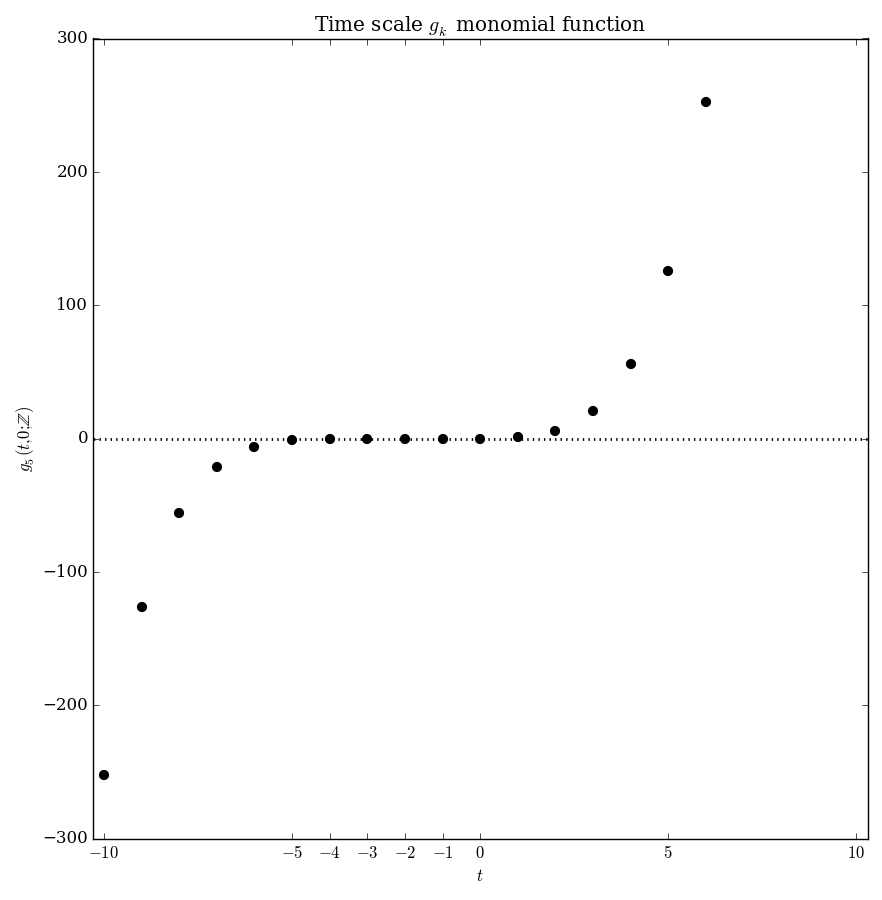 |
23 KB | Category:plot Category:deltaexponential Category:timescale:integers Category:specialfunction <pre>#!/usr/bin/python import numpy as np import matplotlib.pyplot as plt from mpmath import * from pylab import rcParams rcParams['figure.figs... | 1 |
| 22:19, 2 June 2016 | Integergk,k=4,s=0plot.png (file) | 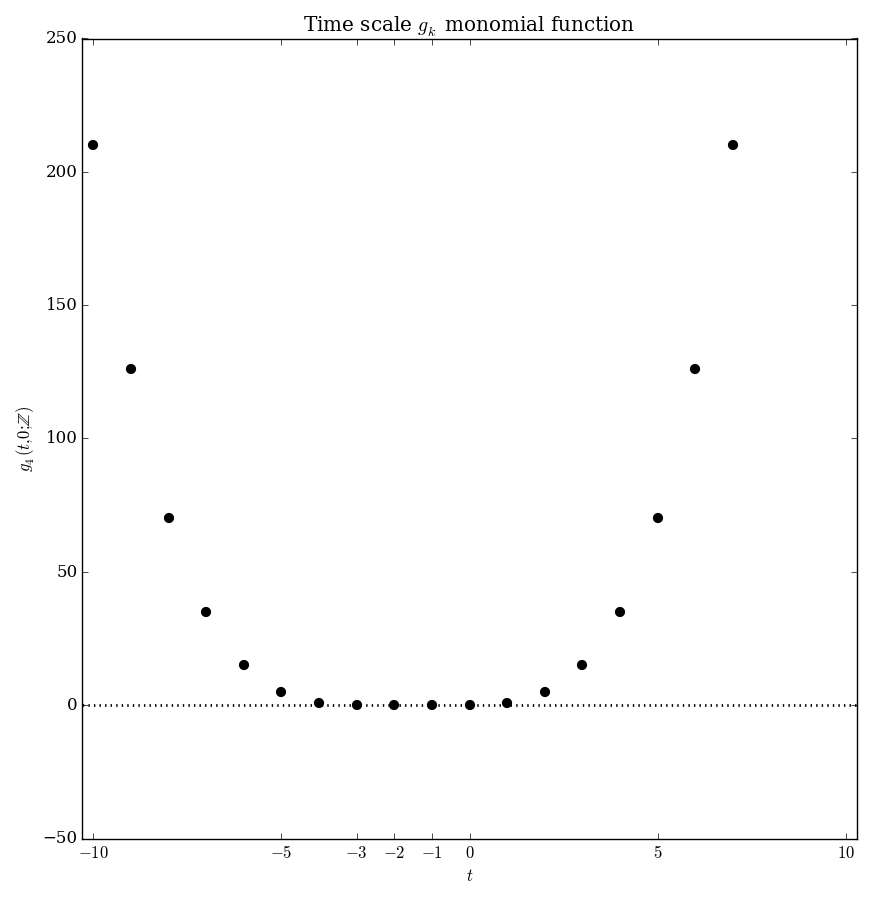 |
21 KB | Category:plot Category:deltagk Category:timescale:integers Category:specialfunction <pre>#!/usr/bin/python import numpy as np import matplotlib.pyplot as plt from mpmath import * from pylab import rcParams rcParams['figure.figsize'] = 1... | 1 |
| 22:22, 2 June 2016 | Integerdeltagk,k=3,s=0glyph.png (file) |  |
2 KB | Category:deltagkglyph Category:glyph Category:timescale:integers Category:deltagk <pre>#!/usr/bin/python import numpy as np import matplotlib.pyplot as plt from mpmath import * from pylab import rcParams rcParams['figure.figsize'] = 2.4... | 1 |
| 22:26, 2 June 2016 | Integerdeltagk,k=2,s=0glyph.png (file) |  |
2 KB | Category:deltagkglyph Category:glyph Category:timescale:integers Category:deltagk <pre>#!/usr/bin/python import numpy as np import matplotlib.pyplot as plt from mpmath import * from pylab import rcParams rcParams['figure.figsize'] = 2.4... | 1 |