Difference between revisions of "File:Hilgercircle,T=hZ.png"
From timescalewiki
(The time scale $\mathbb{T}=h\mathbb{Z}$ has constant graininess function $\mu \equiv h$. Hence if $z$ is a regressive constant, then $$1 + hz \neq 0$$ or $$z \neq -\dfrac{1}{h}.$$) |
|||
| Line 3: | Line 3: | ||
or | or | ||
$$z \neq -\dfrac{1}{h}.$$ | $$z \neq -\dfrac{1}{h}.$$ | ||
| + | |||
| + | The tikz code used to generate this image is: | ||
| + | <pre> | ||
| + | \begin{tikzpicture} | ||
| + | \draw[style=dashed, very thick,fill=black!40] (-1,0) circle (3cm); | ||
| + | \draw[->,very thick] (-5,0) -- (3,0); | ||
| + | \draw[->,very thick] (2,-4) -- (2,4); | ||
| + | \node at (-3.25,-1) {$\mathbb{C}_{\mu(t)}$} ; | ||
| + | \node at (-1,-.5) {$-\dfrac{1}{h}$}; | ||
| + | \end{tikzpicture} | ||
| + | </pre> | ||
Latest revision as of 03:58, 24 July 2014
The time scale $\mathbb{T}=h\mathbb{Z}$ has constant graininess function $\mu \equiv h$. Hence if $z$ is a regressive constant, then $$1 + hz \neq 0$$ or $$z \neq -\dfrac{1}{h}.$$
The tikz code used to generate this image is:
\begin{tikzpicture}
	\draw[style=dashed, very thick,fill=black!40] (-1,0) circle (3cm);
	\draw[->,very thick] (-5,0) -- (3,0);
	\draw[->,very thick] (2,-4) -- (2,4);
	\node at (-3.25,-1) {$\mathbb{C}_{\mu(t)}$} ;
	\node at (-1,-.5) {$-\dfrac{1}{h}$};
\end{tikzpicture}
File history
Click on a date/time to view the file as it appeared at that time.
| Date/Time | Thumbnail | Dimensions | User | Comment | |
|---|---|---|---|---|---|
| current | 20:46, 15 July 2014 | 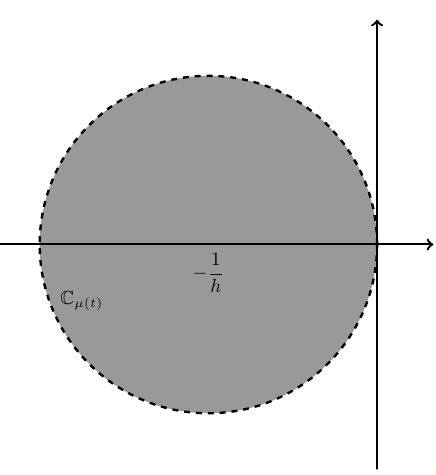 | 436 × 475 (11 KB) | Tom (talk | contribs) | The time scale $\mathbb{T}=h\mathbb{Z}$ has constant graininess function $\mu \equiv h$. Hence if $z$ is a regressive constant, then $$1 + hz \neq 0$$ or $$z \neq -\dfrac{1}{h}.$$ |
- You cannot overwrite this file.
File usage
The following page links to this file: