File:Integercosh,a=0.6,s=0plot.png
From timescalewiki
Size of this preview: 587 × 599 pixels. Other resolutions: 235 × 240 pixels | 880 × 898 pixels.
Original file (880 × 898 pixels, file size: 26 KB, MIME type: image/png)
#!/usr/bin/python
import numpy as np
import matplotlib.pyplot as plt
from mpmath import *
from pylab import rcParams
rcParams['figure.figsize'] = 10, 10
x=np.arange(-5,11,1);
def integerexp(a,t,s):
return (1+a)**(t-s)
def returnzero(t):
return 0
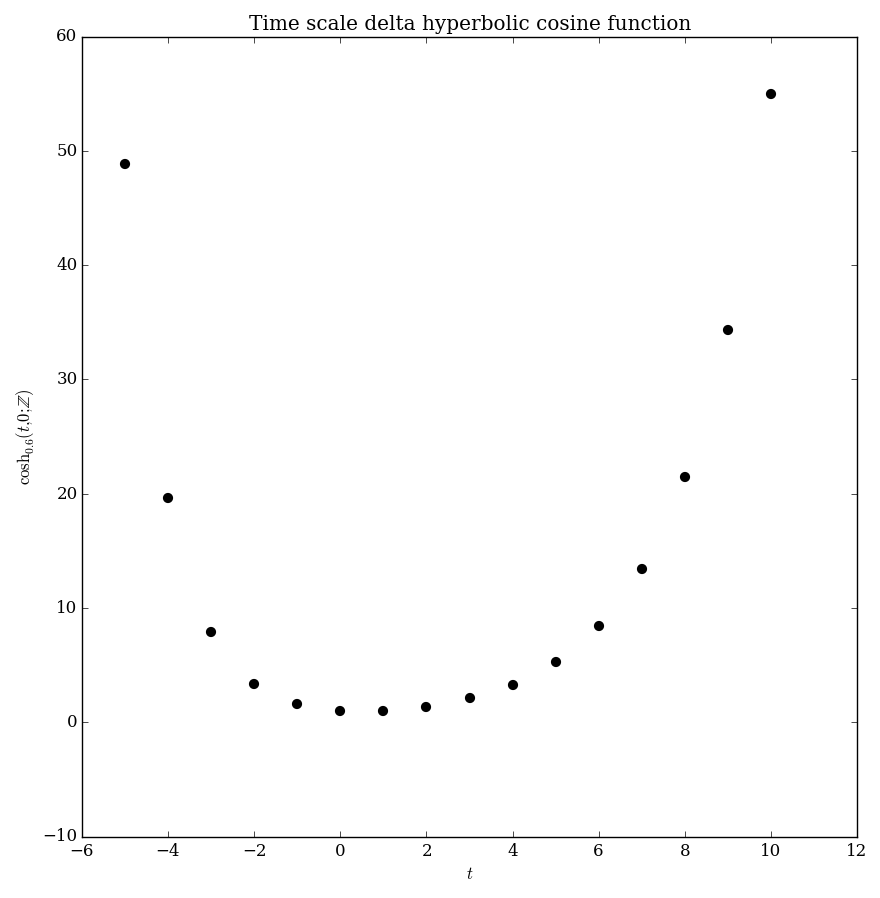
def integercosh(t): # a=0.6,s=0
return (integerexp(0.6,t,0)+integerexp(-0.6,t,0))/2
f=np.vectorize(lambda x : integercosh(x).real)
y=f(x)
fig, ax = plt.subplots()
plt.xlabel(r'$t$')
plt.ylabel(r'$\cosh_{0.6}(t,0;\mathbb{Z})$')
plt.title(r'Time scale delta hyperbolic cosine function')
plt.scatter(x,y,color='Black',s=40)
plt.savefig('integercosh,a=0.6,s=0plot.png',bbox_inches='tight',pad_inches=0.15)
File history
Click on a date/time to view the file as it appeared at that time.
| Date/Time | Thumbnail | Dimensions | User | Comment | |
|---|---|---|---|---|---|
| current | 07:55, 1 June 2016 | | 880 × 898 (26 KB) | Tom (talk | contribs) | Category:plot Category:deltaexponential Category:timescale:integers Category:specialfunction <pre>#!/usr/bin/python import numpy as np import matplotlib.pyplot as plt from mpmath import * from pylab import rcParams rcParams['figure.figs... |
- You cannot overwrite this file.
File usage
The following page links to this file: